Using Claude with IBM Planning Analytics for Excel (PAfE)
Many finance teams already have two things sitting on the same desktop: a TM1 model they pull reports from through Planning Analytics for Microsoft...
4 min read
Accurate forecasting of patient volumes is critical to help hospitals and care providers optimize allocation of resources. This Solution Brief outlines an application to support effective forecasting using IBM Planning Analytics (IBM PA). The document is broken down into the following three areas:
The initial step is to integrate the IBM PA platform with internal systems to automate reporting and analytics. This provides real time insight into patient volume metrics across any dimensions required. Information is aggregated by hospital, department but also by region or any other custom criteria to provide automated reporting and analysis of data.
Access to information in real time is key to help analyze trends and measure efficiency of schedules to handle patient volumes.
In a fully integrated application, IBM Planning Analytics is directly connected to source systems through embedded APIs and connectors. Data is stored in the system at a granular level with several attributes as needed for analysis. Information can be tracked on a daily or even hourly basis by department, location or other variables based on each individual hospital system structures. Data can be updated daily, weekly, monthly, or even intra-day and on demand as needed.
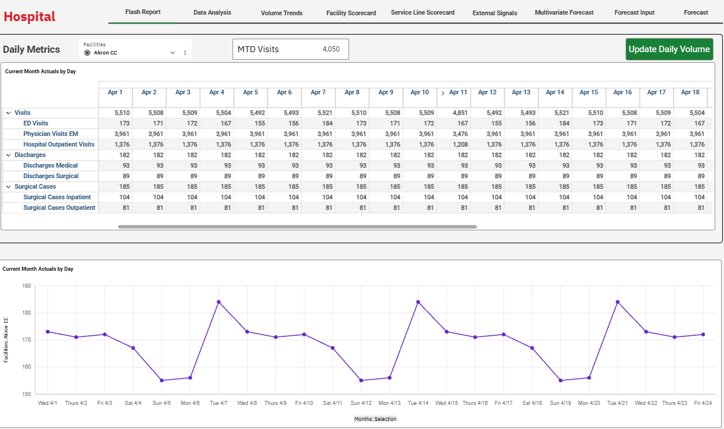
In the chart below, you can see a clear weekly pattern of Emergency Department visits by day for a specific location.
Some of the key benefits and outcomes once data is loaded are the following:
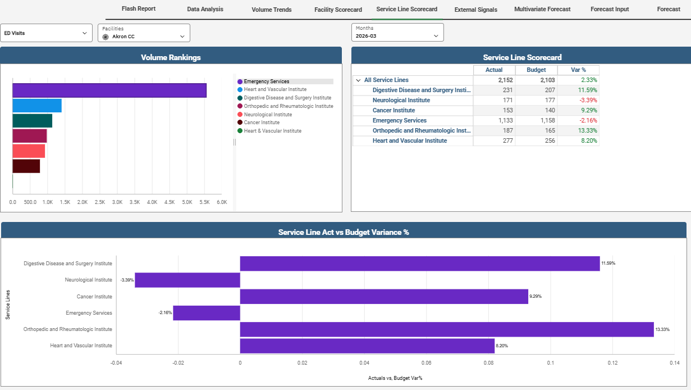
Example dashboard available in the system:
Patient volumes at any hospital are driven by a number of complex variables, which may differ by location, time of the year, department and other. To effectively estimate future volumes with any level of precision, hospitals need to leverage a number of internal and external data sources.
In IBM Planning Analytics, these variables can be incorporated seamlessly into the forecast. They are used as a basis for multivariate statistical forecasting, which is available natively inside the system. The algorithm uses historical patterns based in internal patient volume data for each particular location, department etc. The internal data is then enriched with external factors that can be sourced from the market though and automated interface and factored into the estimate.
The statistical forecast uses the ARIMA, ARIMAX or VAR models depending on each specific data set – the methodology is selected automatically by the system based on the outcomes statistical model metrics. Users can select parameters, such as confidence intervals, but also select time periods and remove outliers to refine the forecast methodology and arrive at desired outcomes.
The estimates are often required by hour as they need to be factored into specific shifts and schedules for different practitioners.
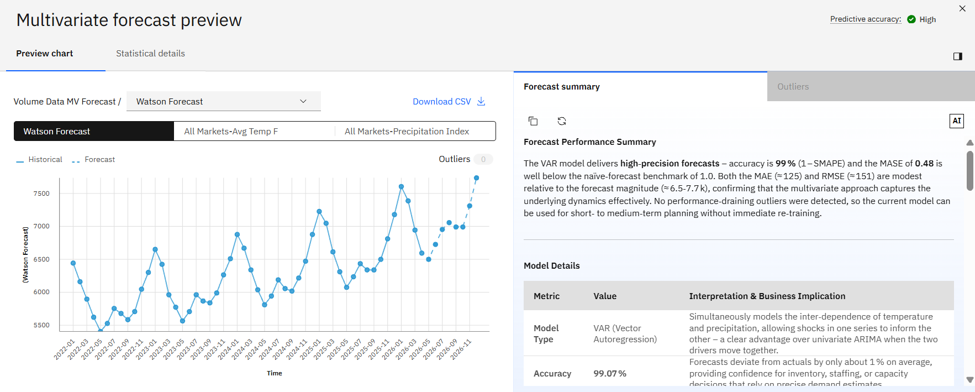
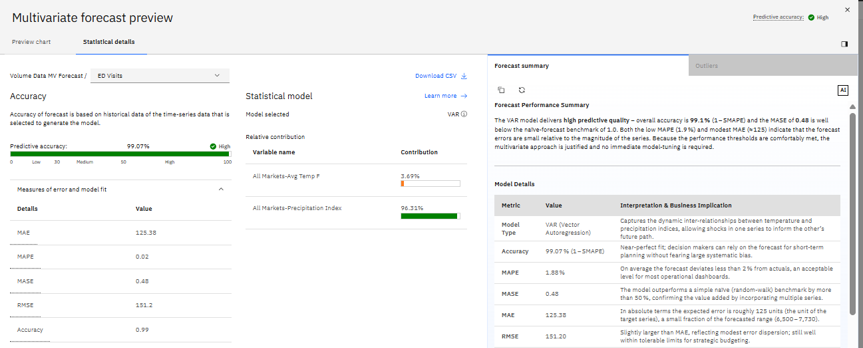
The statistical forecast can be run multiple times in parallel using different assumptions and variables. The system will display the model parameters that describe the statistical model and will provide transparency as to forecast accuracy (picture below). Users can compare the outcomes under different assumptions side-by-side and chose the one that gives them the most accurate result.
Once the patient volume forecast is in place, the next question is how many patients will there be in a specific department requiring care at any point in time. This is a function of a number of variables, in our Emergency Department example we focused on three key ones:
Using these variables, we can model the number of patients that will require care at any point in time. As we can see the figure below, the number of patients in the ED grows as more people arrive in the morning and accumulate receiving care and then trail off in the evening.
The system allows unlimited number of scenarios that can be analyzed in parallel using different assumptions as part of a what-if analysis. These can be managed concurrently and compared side by side to determine best outcome. Multiple users and departments can collaborate using different assumptions and variables. The model changes in real time based on changes in patient volumes as well as assumptions.
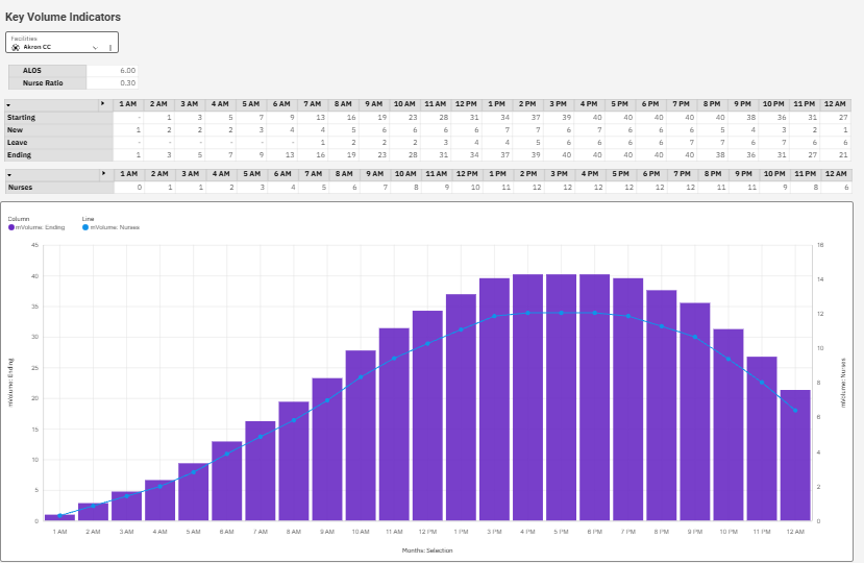
In the final step, users can use this informaiton to allocate resources and practitioners to individual shifts as needed in a way that optimizes resource utilization. This can be done in IBM PA also or the information here can be exported and used in a separate scheduling system if one is in place.
If you would like to discuss this in more detail or see a demo of the application please contact us at solutions@acgi.com.